Larry Williams – Annual Forecast 2026 Download
About Course
- My futures market analysis and predictions for the upcoming year in a single PDF report
- Individual forecasts for the major indexes in Australia, Japan, China, Germany, Russia, Canada, Brazil, Korea, Great Britain, India, Hong Kong, Taiwan, and Italy
- My personal view of where US Stocks, Bonds, Metals, Currencies, Grains, Softs—all the major futures markets—are headed in 2026
- Use my Cycle Forecast Charts as your roadmaps for over 50 stocks & all active futures markets
- Our 21st Annual Edition
- Trusted By Traders and Investors in 79 Countries
Announcing Forecast 2026 Report …
Is it the end? Will stocks crash in 2026?
You don’t have to wait to find out.
I am projecting a major stock market BUYING OPPORTUNITY in 2026.
- Those who recognize it could build fortunes.
- Those who ignore it may face painful losses.
This isn’t speculation—it’s backed by proof. My forecasts for 2023, 2024, and 2025 were published in advance and have already demonstrated the power of stock market cycles.
Short Description
Larry Williams – Annual Forecast 2026 is a 100+ page cycle‑based market roadmap that outlines probable paths for stocks, commodities, currencies, rates, inflation, and recession risk through 2026, built from six decades of historical analysis.
Here’s What You Get
You get forecasts for all major stock market averages, inflation and interest‑rate outlooks, recession timing and drivers, real‑estate trends, cycle projections for all actively traded commodities, and cycle roadmaps for 60+ individual US stocks. You also see examples of past forecasts versus actual results, so you can gauge how to weight the signals and where they’ve historically provided a meaningful edge.
Course / Report Structure
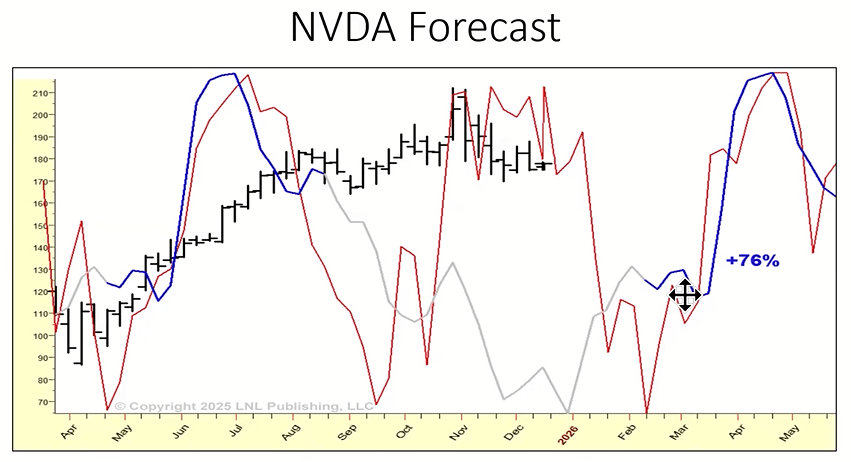
The report is organized into sections: a methodology overview (cycles, probability zones), stock‑market outlook, inflation and interest‑rate section, recession and macro discussion, real‑estate outlook, followed by detailed market‑by‑market cycle charts for indices, commodities, currencies, and selected stocks. Within each market, you’ll see long‑term blue‑line cycles and shorter‑term red‑line cycles mapped against past price data, with commentary on likely turning windows and risk zones during 2026.
Who Should Enroll / Buy
You should get this report if you are a trader or investor who already follows markets and wants a big‑picture timing tool to plan swing trades, position trades, or hedge decisions months in advance. It’s a good fit if you appreciate probabilistic thinking and want to overlay cycle analysis on your existing technical or fundamental work rather than replace your entire process.
Benefits of Participating / Using It
Using the forecast can help you identify when markets are statistically more likely to trend higher, when to be more defensive as cycles peak or roll over, and where major opportunities may emerge in indices, bonds, commodities, and select stocks. It can reduce emotional, headline‑driven decisions by anchoring your planning to long‑tested seasonal, business, and presidential cycles plus Larry’s proprietary timing models.
Report Overview – What It Is For
The Annual Forecast is designed to give traders a single, comprehensive yearly roadmap so they can plan around likely inflection points in stocks, futures, and global markets instead of reacting day‑to‑day. It’s for turning six decades of cycle research into a practical guide that highlights high‑probability windows to buy, take profits, or step aside across 2026.
Highlights
Highlights of the 2026 edition include a generally constructive outlook for stocks with moderate gains and higher intraday volatility, sector rotation with value names favored over expensive growth, an expected late‑2026 risk window as cycles turn down, and detailed cycle maps for key names like Bank of America and other large caps. The report also emphasizes inflation’s next up‑cycle, timing of a likely recession, and how these interact historically with equities, bonds, and real estate, plus cycle forecasts for a wide set of commodities.
Course Content
Unlock the Full Course Package !
-
Download All Course Materials
Student Ratings & Reviews
